นับต่อจากนี้ เราคือ Elev8

เราไม่ได้เป็นแค่โบรกเกอร์ แต่เป็นระบบนิเวศการเทรดครบวงจร ทุกสิ่งที่คุณต้องการในการวิเคราะห์ เทรด และเติบโตอยู่ในที่เดียว พร้อมยกระดับการเทรดของคุณหรือยัง?
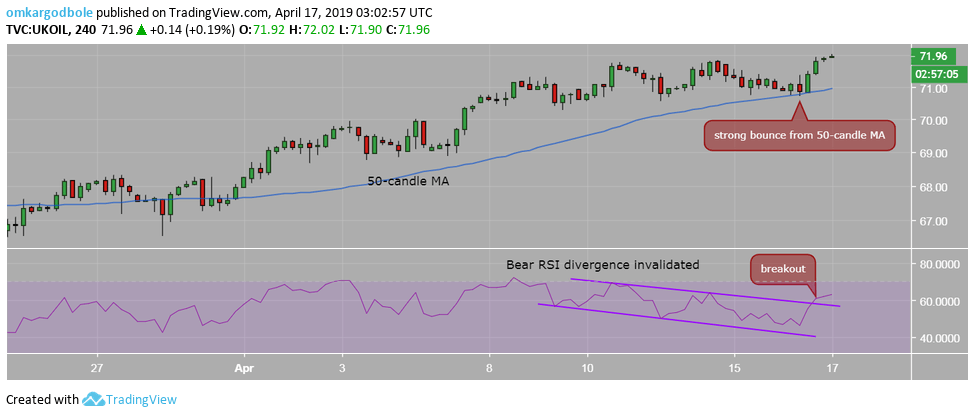
Brent Technical Analysis: Bearish 4H RSI divergence invalidated

  • Brent oil dropped to 4-hour chart 50-candle moving average (MA) yesterday, as expected, only to stage a strong bounce and close above $71.70 engulfing Monday's price action.
  • The resulting bullish outside day candle is a bullish continuation pattern and has invalidated the bearish divergence of the 4-hour chart relative strength index (RSI).
  • More importantly, the indicator has violated the lower highs (bearish divergence) with a falling channel breakout.
  • Brent, therefore, could rise to $72.80 (61.8 percent Fibonacci retracement of $86.71/$50.29).
  • The bullish case, however, would weaken if the prices fall back below the 5-day moving average (MA), currently at $71.50.

4-hour chart

Daily chart

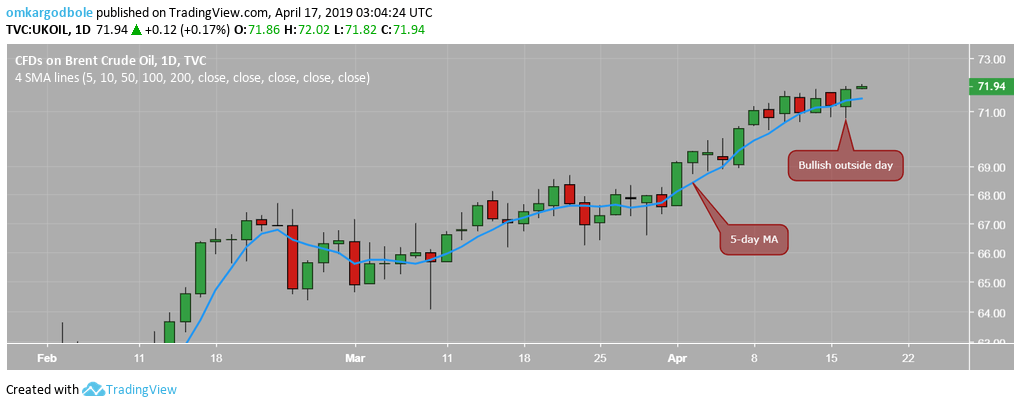
Trend: Cautiously bullish


BHP cuts iron ore production outlook, will it help boost iron-ore prices, Aussie?

BHP Group, the world’s biggest miner, announced on Wednesday that it slashed its forecast for iron ore output after a tropical Australian cyclone, Reu
อ่านเพิ่มเติม Previous

RBNZ inflation data steadies at 1.7% y/y in Q1 2019

The Reserve Bank of New Zealand (RBNZ) is out with its inflation data for the March quarter, with the figures coming in at 1.7% y/y vs. 1.7% previous.
อ่านเพิ่มเติม Next