Kể từ bây giờ chúng tôi là Elev8
Chúng tôi không chỉ là một nhà môi giới. Chúng tôi là một hệ sinh thái giao dịch tất cả trong một—mọi thứ bạn cần để phân tích, giao dịch và phát triển đều có ở một nơi. Sẵn sàng nâng tầm giao dịch của bạn?
Chúng tôi không chỉ là một nhà môi giới. Chúng tôi là một hệ sinh thái giao dịch tất cả trong một—mọi thứ bạn cần để phân tích, giao dịch và phát triển đều có ở một nơi. Sẵn sàng nâng tầm giao dịch của bạn?
EUR/USD declines to 1.1107 amid the initial Asian session on Thursday. The pair traders near the lowest levels in two-week, while being on the back foot for the third day in a row, as it breaks the key SMA confluence the previous day.
With this, sellers may keep a 50-day SMA level of 1.1093 as the immediate target whereas 50% Fibonacci retracement of October-December upside, at 1.1060, could lure them afterward.
However, an upward sloping trend line since October-start, at 1.1048, could restrict the pair’s further downside.
It’s worth mentioning that the 12-day MACD indicator flashes bearish signs.
On the upside, EUR/USD prices need to close beyond the confluence of 21 and 200-day SMA, at 1.1140, to cross the 1.1200 round-figure and aim for the week’s high near 1.1210. In doing so, the 1.1240 top could regain the Bull’s attention.
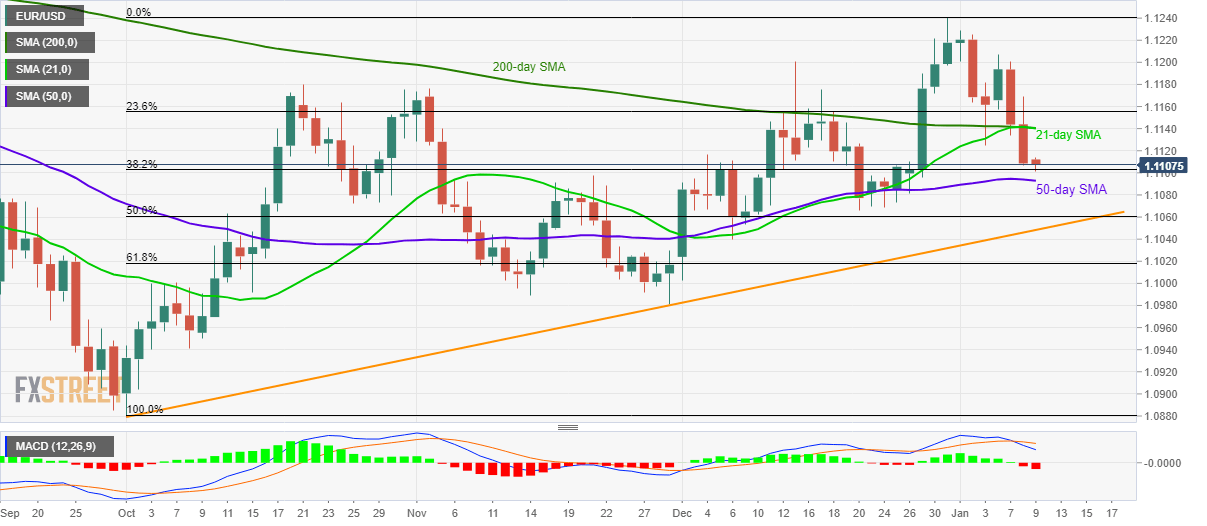
Trend: Bearish