Mulai sekarang kamiialah Elev8
Kami lebih daripada sekadar broker. Kami adalah ekosistem dagangan serba ada—semua yang anda perlukan untuk menganalisis, berdagang, dan berkembang ada di satu tempat. Sedia untuk tingkatkan dagangan anda?
Kami lebih daripada sekadar broker. Kami adalah ekosistem dagangan serba ada—semua yang anda perlukan untuk menganalisis, berdagang, dan berkembang ada di satu tempat. Sedia untuk tingkatkan dagangan anda?
AUD/USD rises to 0.6920 during the early trading hours of Thursday. The Aussie pair flashed a bearish candlestick formation, Doji, on the daily chart on Wednesday. Also increasing the odds of the pair’s pullback is bearish MACD.
Even so, a 200-day SMA level around 0.6890/85 keeps the pair’s short-term downside limited, a break of which can fetch AUD/USD prices to 50% Fibonacci retracement of pair’s October-January month upside, at 0.6855.
During the pair’s weakness below 0.6855, an upward sloping trend line since early October at 0.6823 and 61.8% of Fibonacci retracement near 0.6810 will be important to watch.
On the flip side, the pair’s daily closing above 21-day SMA level of 0.6930 enables the pair to challenge a 23.6% Fibonacci retracement level of 0.6955.
In a case where the buyers manage to cross 0.6955, 0.7000 round-figure will be on their radar.
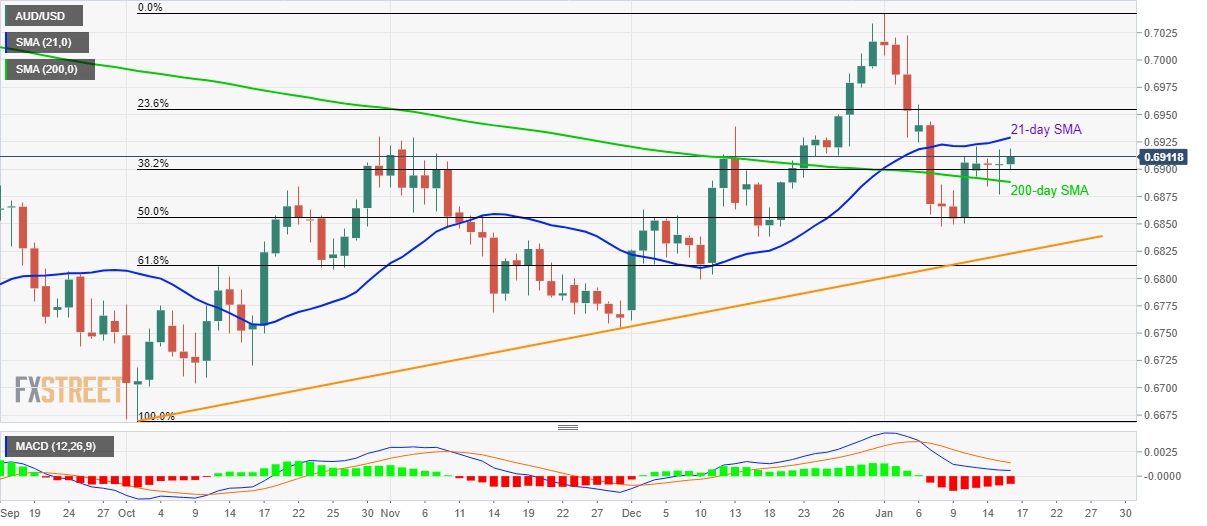
Trend: Pullback expected