Mulai sekarang kamiialah Elev8
Kami lebih daripada sekadar broker. Kami adalah ekosistem dagangan serba ada—semua yang anda perlukan untuk menganalisis, berdagang, dan berkembang ada di satu tempat. Sedia untuk tingkatkan dagangan anda?
Kami lebih daripada sekadar broker. Kami adalah ekosistem dagangan serba ada—semua yang anda perlukan untuk menganalisis, berdagang, dan berkembang ada di satu tempat. Sedia untuk tingkatkan dagangan anda?
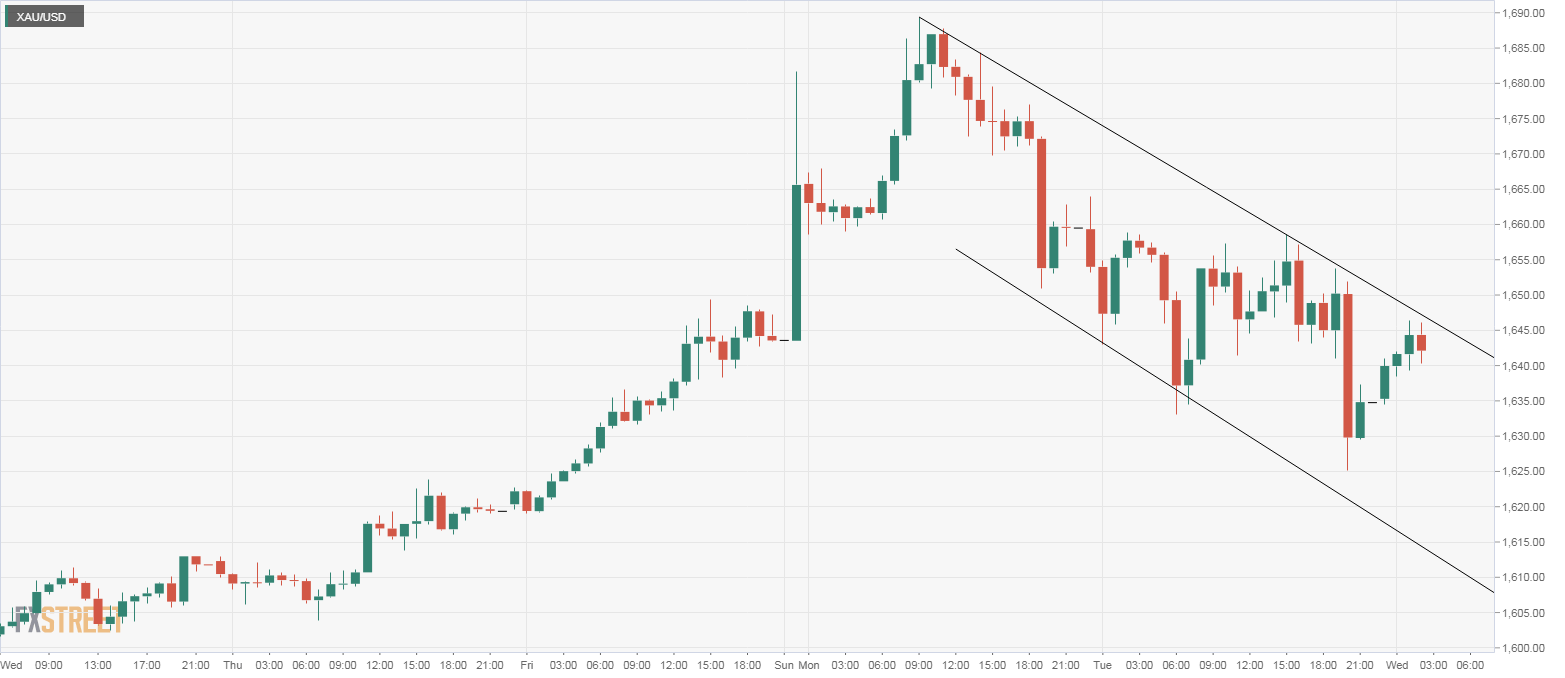
Gold is flashing green in Asia, but the bias remains bearish with prices still trapped in a falling channel on the hourly chart.
At press time, the yellow metal is trading at $1,642 per Oz, representing 0.45% gains on the day.
While the recovery from the overnight low of $1,625 is encouraging, the metal is yet to challenge the falling channel resistance at $1,647. An hourly close above that level would imply an end of the pullback from recent highs near $1,690 and would shift risk in favor of a rise to $1,660 (a lower high on the hourly chart).
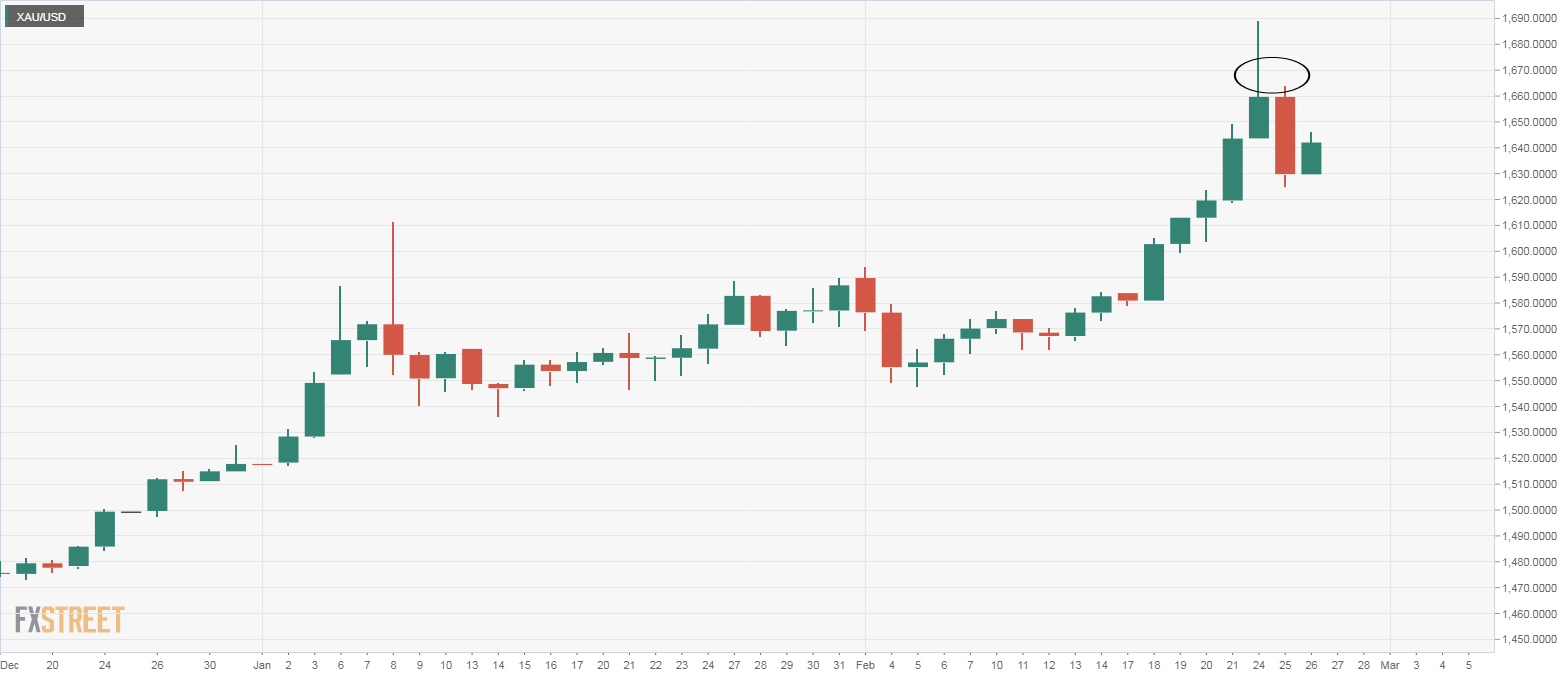
A breakout will likely remain elusive if prices find acceptance under the session low of $1,634. That would validate the bearish reversal pattern seen on the daily chart and could yield deeper declines toward $1,611 (Jan. 8 high).
Trend: Bearish