اب سے ہم Elev8 ہیں
ہم صرف ایک بروکر نہیں ہیں۔ ہم ایک جامع ٹریڈنگ ایکوسسٹم ہیں—ہر چیز جو آپ کو تجزیے، ٹریڈ اور ترقی کے لیے درکار ہو، ایک ہی جگہ پر ہے۔ کیا آپ اپنی ٹریڈنگ کو بلند کرنے کے لیے تیار ہیں؟
ہم صرف ایک بروکر نہیں ہیں۔ ہم ایک جامع ٹریڈنگ ایکوسسٹم ہیں—ہر چیز جو آپ کو تجزیے، ٹریڈ اور ترقی کے لیے درکار ہو، ایک ہی جگہ پر ہے۔ کیا آپ اپنی ٹریڈنگ کو بلند کرنے کے لیے تیار ہیں؟
GBP/USD stays mostly unchanged while taking rounds to 1.2910 during early Thursday. In doing so, the pair remains inside falling wedge formation, below 50-day SMA, while targeting the support line of the pattern.
Considering the bearish MACD and the pairs’ sustained weakness, the Cable is likely to defy the bullish formation by a decline below the 1.2870 immediate support.
Following that, lows marked during November 2019 around 1.2820 and 1.2770 will gain the market’s attention.
On the upside, 50-day SMA offers the immediate resistance near 1.3030 whereas 61.8% Fibonacci retracement of the pair’s November-December 2019 upside, at 1.3055, can please bulls afterward.
In a case where GBP/USD prices manage to rise past-1.3055, a confluence of 50% Fibonacci retracement and the pattern’s resistance near 1.3140/45 will be the key as an upside break of which can propel the quote towards 1.3300 area.
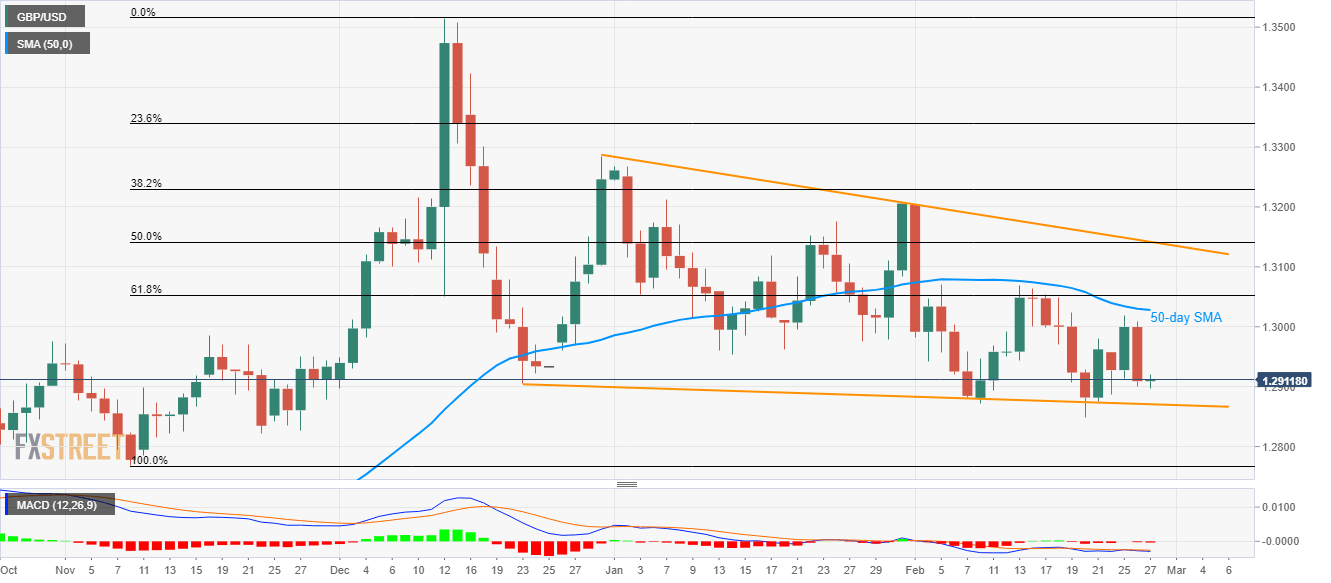
Trend: Bearish